Towards the middle of my first post-doc, back in 2019, my then boss Jon asked me if I would join an exciting and ambitious measurement project which just needed a little extra push to be finished. The UCL PhD student working on it was graduating, and it seemed just a small injection of person power was needed to plug the gap until the work was published. In the end, the little push took nearly five years: the measurement finally came out today, and for most of these five years, I have been the one pushing it (or rather, dragging it, kicking and screaming) towards publication.
But today it’s out! It’s public! A moment I sometimes thought we’d never see. And I am so proud of it. You can find it here https://arxiv.org/abs/2403.02793.
The measurement itself is a differential cross-section measurement of the production of missing energy with jets. In plain English, that means we are measuring the probability that two protons collide to form quarks or gluons (which split into collimated stream of particles called jets due to the strong interaction), along with a deficit of energy which is caused by invisible particles. If we trust the Standard Model, those invisible particles would likely be neutrinos from the decay of a Z boson. But they could potentially also be due to the production of Dark Matter. We also make use of a process called “unfolding” to correct for detector effects, effectively measuring what we suspect happened at the collision point. Here is an example:

The beauty of the measurement is that we *also* measure the differential cross sections for processes involving jets and one or two electrons or muons or a photon instead of missing energy. The idea is that for those processes, you don’t expect Dark Matter to contribute, but in the SM those final states are going to be very closely related to our main measurement (eg a Z bosons decaying to a pair of electrons instead of a pair of invisible neutrinos).
Now here is the cool part: you can take ratios of the main measurement with the lepton or photon measurements, and in doing so cancel out almost all the major uncertainties. Indeed, you’d expect both sets of measurements to be subject to the same fluctuations in systematic uncertainties or modelling effects. If you trust the Standard Model alone that is. Because if Dark Matter is responsible for the missing energy, you’d see that in the numerator but not the denominator… and presto, you then have an extremely sensitive set of observables which could reveal the presence of DM! Here is one of those ratios:
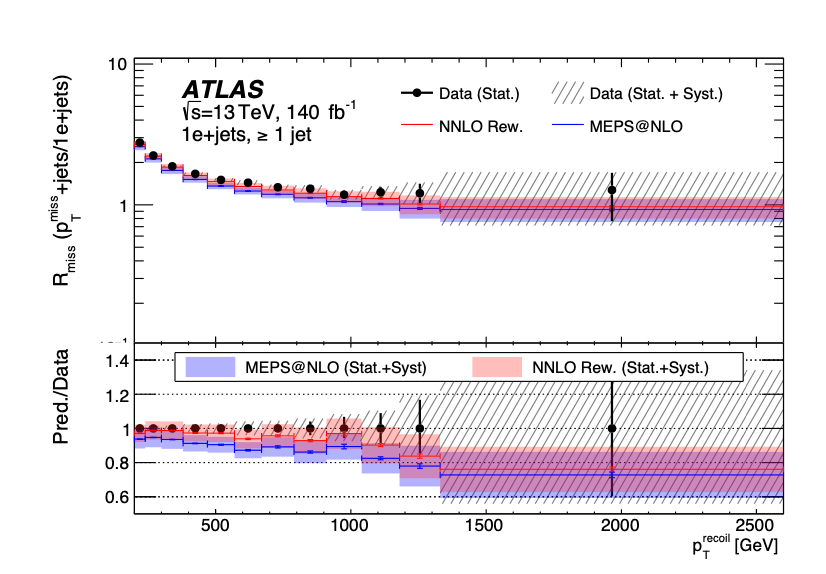
Unfortunately, in the ratios we saw no major deviations, so no discovery to be made, but what we *can* do is set constraints on DM models. Roughly speaking, if DM was being produced at a rate of X, then we’d have seen it, so we can rule out rates of DM production of X and above. And here is a great advantage of our approach: because we made the effort to do the “unfolding”, anyone can now take these results and make the same test with whatever model of new physics they choose. And I really mean anyone: a theorist twenty years from now can come up with a new theory, and use our measurement to see if her model is excluded.
We are not the first ones to look for DM at the LHC. Of course, there have been hundreds of searches for it. But searches are typically “single use”: you optimise for a particular model and look for it, then it’s often hard to derive constraints from that result for a new model. But ours is infinitely re-useable… and it turns out, is almost as sensitive as a dedicated search even though it was totally general.
That’s a fact illustrated by this plot from the paper:

The black solid line is the result we observe when using our ratios to constrain a popular DM model used as a benchmark at the LHC, which the green band indicating our uncertainty on the exclusion. The orange dashed line represents one of ATLAS’s flagship searches for DM, which was optimised for this type of model. Everything contained by those contours is excluded. You can see that the black and orange lines match pretty much everywhere: that means that our method was very nearly as good as a dedicated search. Except that ours is re-useable forever.
So, this is a measurement I am extremely proud of, even if it did take five years to produce. Why did it take so long? Well, the measurement turns out to be more ambitious than we’d anticipated, but also the nature of the final state meant that very little advanced filtering could be done, meaning that each time we reprocessed our samples, the turnaround time was a couple of months. And when things started to drag on, it created a vicious circle where people would start graduating or leaving the collaboration, so we’d need to ramp up new analysts, leading to further delays… There were also some “artistic differences” between different teams participating in the measurement which took us a while to iron out, but eventually that discussion led to a more complete analysis. And finally, measurements take time: there is nowhere to hide, no rug to sweep issues under. But what is five years when you’ve produced a result that could still be relevant 100 years from now?

2 thoughts on “A measurement five years in the making”